iOFFICE Dashboards: The Secret to Better Data Analytics


The iOFFICE solution is a powerful tool. How powerful? Well, let’s just say if Harry Potter started a career in real estate or facilities management after graduating from Hogwarts, he’d probably be one of our biggest fans.
One of the most magical parts of the iOFFICE platform is the dashboards, which empower corporate real estate (CRE) directors, space planners and facilities managers to make more effective data-driven decisions.
Here’s the lowdown on iOFFICE dashboards.
What Is an iOFFICE Dashboard?
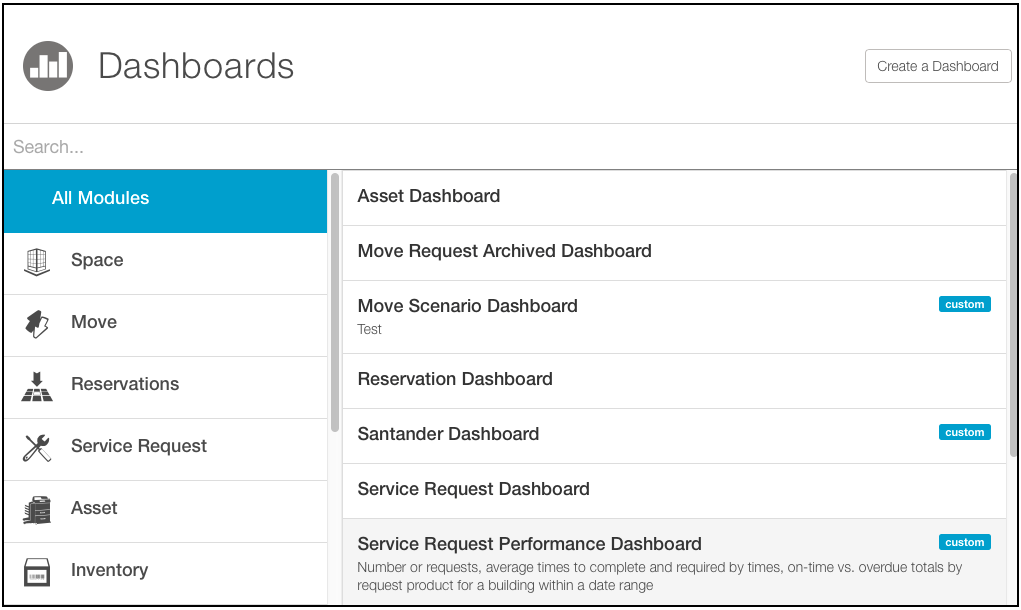
An iOFFICE dashboard is a set of individual reports consolidated into a single, integrated view. Dashboards can be organized by module or can reflect a combination of analytics from different modules. iOFFICE dashboards also enable users to …
- Run multiple reports simultaneously
- Compare various related data points to identify patterns and trends
- View data in tabular and graphic formats for easier analysis

Dashboards are updated automatically and can also be programmed to be sent to specific recipients by email on a set schedule—for example, daily or weekly. iOFFICE customers can also access additional dashboards and reports by embedding text and image hyperlinks within a dashboard. Custom dashboards can be exported in various file formats directly from the software, making it simple to share data with colleagues or vendors.
What Benefits Do iOFFICE Dashboards Offer Users?
In general, iOFFICE dashboards are designed to improve the lives of CRE directors, space planners and facilities managers by giving them quick access to real-time data that helps them meet their unique goals.
More specifically, iOFFICE dashboards enable CRE directors to identify opportunities to consolidate space or potentially sublet to other businesses. The dashboards give them greater visibility into past and current statistics so they can more accurately estimate future space needs. Dashboards help space planners better visualize the best ways to organize workspaces for optimal efficiency and productivity. For facilities managers, dashboards assist with identifying at-risk assets by showing the facilities manager which assets have had multiple service tickets issued for them. Finally, facilities managers can use iOFFICE dashboards to make sure service level agreements (SLA) are consistently being met by allowing them to confirm work orders are being completed as quickly as possible.
How Do I Decide Which Reports to Include in a Dashboard?
Because the iOFFICE solution collects thousands of data points, CRE directors and facilities managers must first identify which statistics and metrics are the most critical. They need to think about what data they always seem to be on the hunt for—whether it’s for themselves, vendors or the executive team.
Let’s break it down by role.
If you’re a CRE director, you’re most likely interested in…
- Number and locations of properties being leased
- Monthly and yearly lease obligations
- Lease abstracts—including contract dates, renewal options and monthly payment
- Utilization at building- and portfolio-level
- Total capacity vs. actual occupancy
A space planner would probably want to know…
- Total building capacity
- Actual space utilization
- Space allocation by department
- Location, size and type of available space
- Forecasted space demands
- Total square footage
- Square footage by building and by floor
- Price per square foot per person
And finally, a facilities manager would want insight into…
- Total service tickets that have been assigned
- The status of each ticket
- Number of work orders by request type—for example, equipment service, temperature adjustment or lighting issues, to name a few
- Amount of overdue tickets
- Cost of work orders
- Maintenance costs by building
- Number of work orders for reactive maintenance v. scheduled maintenance
- Which assets and buildings have required a higher than average number of service requests
If you find yourself drowning in a sea of data and/or wasting time manually aggregating information from multiple reports, iOFFICE dashboards can be your rescue boat. We’d love to talk to you more about your data analytics needs. Drop us a line!
